

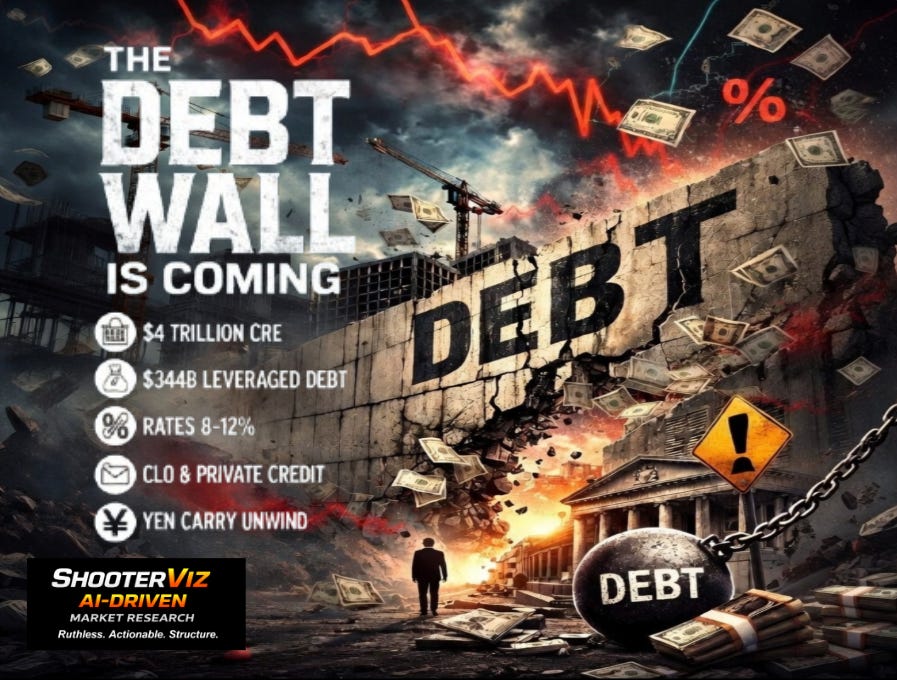
THE DEBT WALL IS COMING
A structural problem the market hasn’t fully priced yet
This issue is not singular. It will touch every inch of the globe.
First, let me give the necessary backdrop.
Why the Debt Wall Exists
Let me start with the uncomfortable truth.
There is no clean public list of every company facing a refinancing wall.
A massive portion of this debt sits inside private credit funds, leveraged loan markets, and commercial real estate vehicles that never trade in the open market.
Its called Private Credit
But the scale of what’s coming isn’t theoretical.
Across leveraged loans, private credit, and commercial real estate, we’re looking at roughly:
$344B of corporate leveraged debt maturing between 2026–2028
$539B of CRE loans maturing in 2026
$550B of CRE loans maturing in 2027
More than $4 trillion of CRE debt rolling between now and 2029
So the real headline figure is roughly:
≈ $4.3 trillion in refinancing pressure between now and 2029.
AKA — why the 2030 Survival Blueprint exists…
The Size of the Debt Wall?
(Size of the Debt Wall vs Major Financial Crises)
Global Financial Crisis (2008)
Key stress points:
~$1.3T in subprime mortgage exposure
~$5T in mortgage-backed securities tied to housing
~$10T+ housing market collapse
But the actual catalyst was refinancing failure, not the total housing value.
Relative comparison:
Debt wall today: ~$4.3T
Subprime exposure in 2008: ~$1.3T
➡️ Today’s refinancing wall is roughly 3x the size of the subprime trigger pool.
The difference is that today’s risk is distributed across corporate credit and CRE, not concentrated in mortgages.
Savings & Loan Crisis (1980s)
~1,000 banks failed
~$160B bailout cost
~$1T+ real estate losses in today’s dollars
Relative size:
➡️ Today’s CRE refinancing wall alone ($4T) is 4× larger than the entire S&L real estate problem.
Dot-Com Bust (2000–2002)
The crisis was equity market driven, not credit.
~$5T wiped from Nasdaq market cap
Debt stress relatively small compared to today.
Relative comparison:
➡️ Today’s issue is far more credit-driven, which historically causes deeper economic damage.
COVID Liquidity Crisis (2020)
Corporate debt spike:
~$10T total U.S. corporate debt
Fed stepped in immediately with liquidity programs.
But refinancing stress never materialized because rates collapsed.
Relative comparison:
➡️ Today is the first real refinancing cycle since rates were normalized.
World War Financing
World War II:
U.S. debt increased from $40B → $250B
~120% of GDP
But that was government debt, not corporate refinancing risk.
Different dynamic entirely.
Relative to the Current Economy
Current U.S. economy:
U.S. GDP: ~$28T
Total U.S. corporate debt: ~$13T
Total CRE debt: ~$5.5T
So this debt wall represents roughly:
≈ 15–20% of the entire U.S. corporate + CRE credit system needing refinancing within a few years.
That’s the real issue.
Not the size.
The concentration in time.
That’s not just a maturity schedule.
That’s a refinancing event.
And the reason it exists is simple.
During the 2020–2021 zero-rate era, companies borrowed money at levels that only made sense in a world where capital was essentially free.
Private equity sponsors levered companies aggressively.
Growth companies funded expansion with convertible debt.
Commercial real estate assumed cheap refinancing would always be available.
Then the rate regime changed.
Almost overnight.
Debt that once cost 3–4% now refinances closer to 8–12%.
For some companies, that’s manageable.
For others, it’s catastrophic.
And this ties directly into something I wrote about earlier in The Great Rebalancing, where global capital is shifting away from the era of unlimited liquidity toward a more fragmented, politically driven financial system.
Read that here: The Great Rebalancing
Capital is no longer moving freely across the globe.
Which means refinancing is no longer automatic.
Why Some Companies Break — And Others Don’t
Not every company facing the debt wall fails.
But the ones that do usually share the same characteristics:
High leverage
Floating-rate debt
Declining cash flows
Capital-intensive business models
That combination becomes toxic when refinancing hits.
Take Wolfspeed (WOLF).
A high-growth semiconductor story that piled on roughly $6.5B in debt while building out silicon-carbide manufacturing capacity.
That works when capital markets are easy.
But when demand slows and refinancing costs double, lenders suddenly start dictating terms.
Creditors have already discussed hundreds of millions in rescue financing just to stabilize the balance sheet.
That’s what the early stage of a maturity wall looks like.
Another example sits in the industrial sector.
Babcock & Wilcox (BW) carries roughly $300M of debt maturing in 2026 and has already hired restructuring advisors.
That’s usually not a great sign.
Meanwhile, in the private-equity ecosystem the problem is even larger.
Software deals completed during the ZIRP era were financed assuming ultra-cheap capital would remain available indefinitely.
About 46% of software sector leveraged loans mature within the next four years.
Examples include companies tied to LBO structures such as:
Informatica
Pluralsight
McAfee enterprise segment
Multiple Thoma Bravo portfolio companies
These deals were financed when borrowing costs were near zero.
Refinancing today often means doubling the interest expense.
And this is exactly where another layer of risk sits.
Inside Collateralized Loan Obligations (CLOs).
I wrote about this earlier here: Collateralized Loan Obligation
CLOs package leveraged loans into structured securities held by banks, insurance companies, and institutional investors.
When refinancing pressure hits leveraged borrowers, the stress doesn’t stay contained.
It travels through the credit system.
Stress Inside the Shadow Credit System
Now ask the next question.
What happens when the very vehicles providing private credit start experiencing liquidity stress themselves?
Private Credit Vehicles Seeing Elevated Redemptions
The list has grown exponentially. These funds aren’t frozen yet, but redemption pressure is clearly building as investors begin pulling capital from semi-liquid private credit vehicles across the globe.
Antares Strategic Credit Fund (ASTAR)
Apollo Debt Solutions BDC (ADS)
Ares Strategic Income Fund (ASIF)
Bain Capital Private Credit (BCPC)
Blue Owl Credit Income Corp (OCIC / OBDC platform)
Blue Owl Capital Corp II (OBDC II)
Blackstone Private Credit Fund (BCRED)
BlackRock HPS Corporate Lending Fund (HLEND)
Cliffwater Corporate Lending Fund (CCLFX)
KKR Private Credit Opportunities Funds
TPG Twin Brook Capital Credit Funds
Golub Capital Private Credit Funds
Oaktree Strategic Credit Funds
Carlyle Credit Opportunities Funds
PIMCO Private Credit Funds
Barings Private Credit Funds
HPS Investment Partners Private Credit Funds
The real issue here isn’t just capital leaving.
It’s that the structure itself starts to crack when the promise of periodic liquidity runs head-first into portfolios built on long-duration, illiquid loans.
That’s when turbulence becomes stress.
When lenders begin dealing with their own redemption pressure, the entire private credit machine can tighten at once.
Credit gets rationed.
Weaker borrowers get exposed.
Refinancing risk rises.
And what once looked like stable yield suddenly starts behaving like hidden leverage.
That’s when the market stops asking who was reaching for yield…
…and starts asking who actually has the cash.

The Energy Catalyst Most People Are Ignoring
Debt stress rarely arrives alone.
It usually needs a catalyst.
Right now that catalyst may be energy costs.
Geopolitical risks in the Strait of Hormuz highlight just how fragile global supply chains can become when a key shipping corridor gets disrupted.
Higher oil prices feed directly into corporate cost structures.
Transportation costs rise.
Manufacturing inputs become more expensive.
Supply chains tighten.
Companies already facing higher refinancing costs now face higher operating costs as well.
Margins compress.
Cash flows shrink.
And refinancing suddenly becomes much harder.
Industrial Policy Is Redirecting Capital
But there’s another dimension here.
Industrial policy.
The United States is aggressively pushing technological dominance in sectors like:
semiconductors
quantum computing
advanced materials
AI infrastructure
The Genesis Mission initiative aims to accelerate scientific discovery by linking national laboratories, industry, and advanced computing resources into a unified research platform.
That’s not just science policy.
It’s capital allocation policy.
Resources will increasingly flow toward:
AI infrastructure
semiconductor manufacturing
energy systems
advanced materials
Which means capital may rotate away from weaker legacy sectors, leaving those segments exposed to liquidation.
I wrote about that dynamic here:
Trump’s Genesis Mission Road Map
Industrial policy accelerates innovation.
But it also reshapes where capital flows.
And that can leave highly leveraged companies stranded on the wrong side of the credit cycle.
Where the Weakness Is Hiding
The debt wall isn’t evenly distributed.
It concentrates around specific sectors and business models.
Private Equity Portfolio Companies
These are classic leveraged buyout structures.
Typical borrower profile:
$10M–$100M EBITDA companies
owned by private equity sponsors
financed with floating-rate loans
5–7 year maturities
Many of these deals were completed between 2020 and 2022.
Which means refinancing pressure builds between 2026 and 2029.
Common industries include:
industrial roll-ups
HVAC distributors
healthcare staffing firms
IT services companies
Most of these companies are invisible to public markets.
These shadow loans are embedded across thousands of private credit portfolios, much like MBO-style structures were before the Great Recession.
Investors bought them for the same reason they always do.
Capital naturally chases yield.
Commercial Real Estate
This may be the largest maturity wall of all.
Office and multifamily debt alone includes:
$539B maturing in 2026
$550B in 2027
And office valuations in many major cities remain 30–40% below peak levels.
That creates a brutal refinancing problem.
Public proxies include:
SL Green Realty
Vornado Realty Trust
Brookfield Office Properties
Blackstone Real Estate Income Trust
Banks holding these loans also become exposed.
Regional Banks
Certain lenders carry heavy exposure to commercial real estate refinancing.
Names traders often watch include:
Flagstar Financial (FLG)
Valley National Bancorp (VLY)
Zions Bancorporation (ZION)
And here’s where another macro variable matters.
Global liquidity.
The Yen carry trade has historically been one of the largest funding sources for global leverage.
When that unwinds, global liquidity contracts quickly.
I wrote about that risk here: The Yen Survival Blueprint
When global funding tightens, refinancing gets harder.
Which means the debt wall becomes taller.
The Domino Timeline
This is how these cycles usually unfold.
Not all at once.
Not in one giant headline.
Not in some clean, cinematic crash moment where everyone suddenly “gets it.”
That’s not how stress works.
It moves like a domino chain.
One pressure point tips into the next.
One tight pocket of liquidity exposes another.
One refinancing problem becomes a lender problem.
Then a sector problem.
Then a broader repricing.
That’s why most people are late.
They’re waiting for a single event.
What they should be watching is the sequence.
2026 ➜ The Cracks Start Showing
This is where the market begins to notice that refinancing is no longer automatic.
Deals get delayed.
Terms get repriced.
Lenders demand more protection.
Sponsors put in rescue capital they didn’t expect to put in.
This is the phase where management teams still try to frame things as “temporary.”
But under the surface, the math is already changing.
A company that could survive at 4% debt suddenly looks very different at 9%.
We are already seeing these cracks showing up.
2027 ➜ Liquidity Tightens and Weak Hands Get Exposed
This is where the pressure starts spreading.
Companies that were already limping into the wall now have to refinance into a market with less patience and higher demands.
Cash flow matters more.
Collateral matters more.
Covenants matter more.
Actual liquidity matters more.
And this is where weaker business models start getting sorted out fast.
Not because they suddenly became “bad companies,” but because the environment changed and their capital structure no longer works.
This is where forced asset sales, distressed exchanges, rescue financings, and restructurings start showing up more regularly.
2028 ➜ The Repricing Becomes Obvious
By this stage, the market usually stops debating whether the problem is real.
Now it becomes a question of scale.
Losses migrate through the system.
Borrowers feel it.
Lenders feel it.
Private credit vehicles feel it.
Regional banks feel it.
Structured credit feels it.
What was once sold as stable yield starts getting repriced as risk.
And once that happens, capital doesn’t just get cautious.
It gets selective.
That’s when entire sectors can be left behind.
2029 and Beyond ➜ Survivors, Consolidators, and New Leadership
Every debt cycle creates wreckage.
But it also creates leadership.
The companies with real cash flow, better balance sheets, and access to capital come out stronger because they can buy assets, take share, and survive while weaker players are forced to retreat.
That’s the part people forget.
A debt wall is not just destruction.
It’s also reallocation.
Capital leaves weak structures and moves toward stronger ones.
That’s why this is not just a warning.
It’s also a roadmap.
Why this Matters the most?
Most investors spend too much time trying to predict the exact day something breaks.
That’s usually the wrong game.
The better game is understanding the sequence early enough to know where stress is likely to surface first, where it spreads next, and which names benefit once the washout begins.
That’s the real edge.
Not guessing.
Not panicking.
Understanding the dominoes before they start falling.
The Watchlist — 10 Names Where Stress Could Surface 1st
Wolfspeed (WOLF) Looks destined for continuation…
Babcock & Wilcox (BW)
Fossil Group (FOSL)
Blue Owl Capital (OWL) Current failure…
Jefferies Financial Group (JEF) Were testing the shelf here…
Western Alliance Bancorp (WAL)
Flagstar Financial (FLG)
Valley National Bancorp (VLY) Structually looks ready to role over…
Zions Bancorporation (ZION)
Apollo Global Management (APO)
These are not guaranteed failures.
Think of them as expressions of the debt cycle.
Some are borrowers.
Some are lenders.
Some are liquidity proxies.
One Trade Strategy to Consider
The biggest mistake traders often make with debt-cycle trades is going all-in too early.
Distressed cycles unfold in stages:
1️⃣ Refinancing attempt
2️⃣ Delayed deal
3️⃣ Restructuring negotiation
4️⃣ Equity repricing
One cleaner approach is defined-risk option structures.
Example:
Buy a near-term put.
Sell a deeper out-of-the-money put.
This caps downside risk while still allowing participation if the equity reprices lower.
Another approach is a pair trade:
Short a weak credit proxy while holding exposure to a firm that historically profits during distressed cycles.
That isolates the credit cycle itself, rather than betting on broad market direction.
Rapping this up!
By now, if you follow my work at all, you’ve probably realized there’s a method to my madness.
First, you have to understand the game you’re actually playing if you expect to compete.
Then, if you want to win, you have to become a student of its strengths, weaknesses, pressure points, and the moments when the structure starts to fail.
That’s the thesis.
I’m not interested in reacting blindly to headlines.
I’m interested in understanding the machinery well enough to recognize where the real advantage is before the crowd does.
That’s the edge most investors and traders misunderstand.
It’s the timing.
The debt wall doesn’t arrive all at once.
It builds like a pressure cooker.
Slowly.
One event at a time.
The cycle likely unfolds something like this:
2026 ➜ Refinancing stress begins to appear
2027–2028 ➜ The true distressed cycle emerges
I can’t sugarcoat this.
Any investor caught on the wrong side of the events we’ve talked about and identified over the last two quarters can get smoked — and I’m talking about 20–30% drawdowns. Some companies will become insolvent. My goal here is simple: make sure we are not caught standing in front of that train.
Add global liquidity tightening on top of private credit stress — whether through rising energy costs, a yen carry unwind, or capital reallocation driven by industrial policy — and that cycle accelerates.
Which means the smartest place to start isn’t prediction.
It’s preparation.
Because the Debt Wall isn’t a theory.
It’s already on the maturity schedule.
And the calendar is sitting right here inside the 2030 Survival Blueprint.
Good thing to keep in front of us... thanks for making a clear case to be aware and wary.